Here are the quickest and easiest methods to check memory usage on your Linux system.
If you find your home Linux machine is a bit sluggish or your web server keeps hanging, it’s worth checking whether anything is hogging your memory. It may be that a poorly-coded page is using up a disproportionate amount of system resources, or it may be that your computer or server doesn’t have enough RAM for the task assigned to it.
Either way, these useful tools will help you diagnose the issue by displaying how much memory you have available and what processes are using your system resources.
Free vs. Available Memory
Free memory is the amount of unused memory, and available memory is the amount of memory available for allocation.
What’s the difference between free and available memory? Linux tries to use up as much memory as is available – there’s no point in having unused system resources if they can be allocated to make something happen faster!
Thus, there usually won’t be much free (totally unused) memory available as Linux will try to put it to use wherever it can. Available memory has been put to use but can be re-allocated to new or existing processes that actually require the resources.
Using the free Command to Check How Much Memory is Available
The free command displays the amount of free memory on your system. It’s easy to use – execute the command:
free
The values displayed will be in kibibytes (1,024 bytes). To make things more readable, you can pass the -h option to free to make things more human-readable:
free -h
To view the full list of options available to the free command, check out the user manual by running:
man free
Using the top/htop Command to See What Resources Applications are Using
top displays a live-updated table with various statistics about running applications and services- including memory usage. Simply run:
top
An alternative to top, htop performs the same task but looks prettier. It can be run by executing:
htop
htop may not be installed on all systems by default – You can view our full article on installing and using top and htop here.
Viewing /proc/meminfo to get Information About System Memory
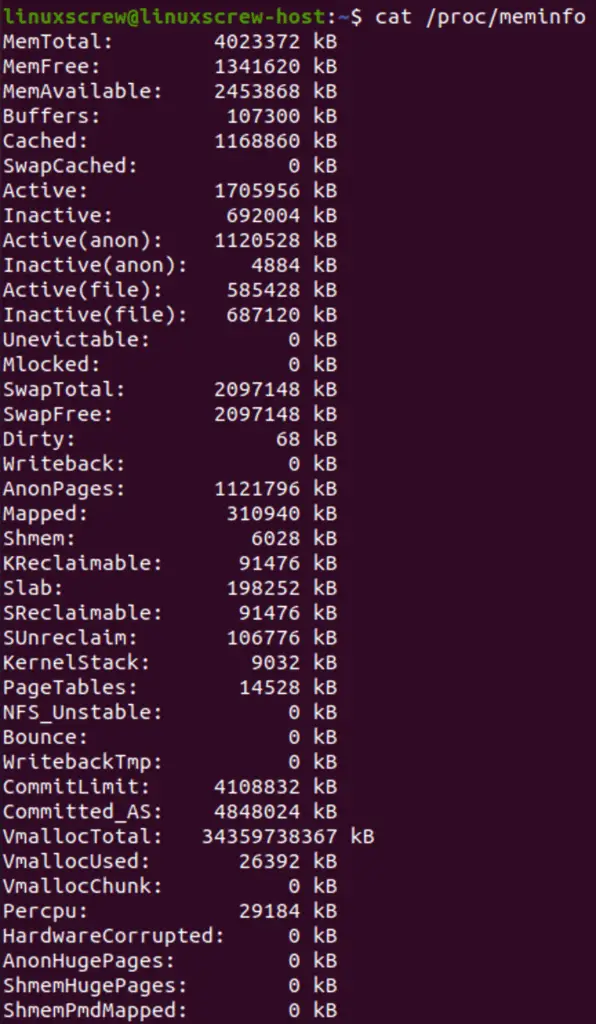
You can display detailed information about memory usage by viewing the contents of the virtual file at /proc/meminfo using the cat command:
cat /proc/meminfo
The following information will be displayed:
The top 3 lines are the most relevant, listing the total, free and available memory.
Using vmstat To View Virtual Memory Usage
vmstat will report statistics regarding virtual memory. Virtual memory is a way of compensating for a low amount of physical RAM by storing temporary data on disk rather than in memory. It’s slow, but in a pinch, it can help with resource-intensive tasks when physical memory is insufficient.
vmstat
The main values of interset are swpd (amount of virtual memory used) and free – the amount of unused virtual memory. You can view the full user manual for the vmstat command by running
man vmstat
Using dmidecode to View Detailed Information about Physical Memory
Finally, if you really want to know the fine details about the physical RAM installed in your system, you can run dmidecode:
sudo dmidecode
Note the use of sudo to run with administrative/root privileges.
This will output a bunch of really in-depth info about the memory installed in your system. If you are a performance freak, it’s helpful to ensure you have the best RAM installed for your CPU/motherboard combination.
Conclusion
Looking for more information about your system? Click here to view our article on viewing CPU information in Linux.


